August 26th, 2022
posted
by Andrew Blomme on 8/26/2022
in
Weekly Newsletter

August 26th, 2022
We are getting toward the finish line for this year's crop. With that being said this week's update will cover what will happen in this crop between now and black layer.
The the table below is an awesome graphic that shows how each stage of corn development corresponds to the percentage of yield already made.

There are a few things that I want to highlight on this table. The first is that when we start to see kernels denting that means that we have roughly 30 days left of our grain fill period. At this point about 2/3rds of the starch that will be in a kernel is already there. These next 30 days are responsible to fill the last third of that kernel.
Second thing I want to emphasize is that this grain fill period is not equal across the 30 days. The majority of the grain fill that is yet to happen will happen in the first 15 days after dent. Adequate moisture and low environmental stress right now will benefit us much more than it would in 14 days time.
A Look Outside West Central Iowa
This week the Pro Farmer crop tour took place throughout the corn belt to gauge corn yields ahead of the fall. Those early estimates have been rather disappointing with yields below early estimates. The map below may provide some insight as to why that is. It shows the precipitation ranks of different climate regions throughout the corn belt. This map specifically looks at rainfall from mid-July, the start of pollination, through today. Our area of the state has a "106" on it. That means that in the last 130 years, there have been 105 years with more rainfall over this period than we have had in 2022. Essentially the more brown the area of the map the drier it has been and the more blue it is, the wetter than usual that area is.
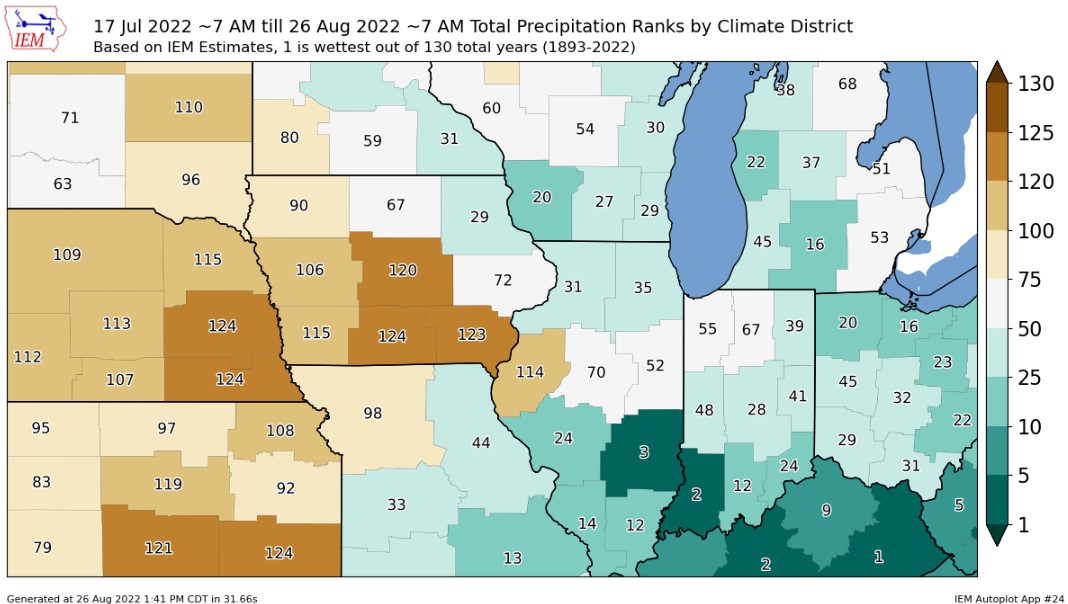
You can make lots of conclusions from this map but the general trend is that except for a few pockets, everywhere west of the Mississippi river has had a significantly dry grain fill period. It will be interesting to compare this map to the USDA's 2022 corn yield numbers when those get released. I would bet there will be a correlation.
I would also like to note that in west central Iowa, from I-80 up to 30 miles north have been the wettest part of the region. Some of us have been very fortunate as far as precipitation. When you get up to Sac County or a ways south of I-80 the same can't be said.